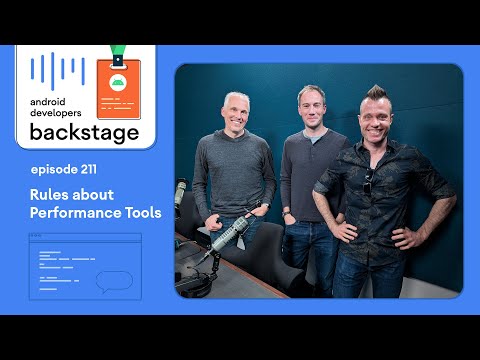
Rules about performance tools – Android Developers Backstage
Video by Android Developers via YouTube
Source

In this episode Chet, Romain and Tor chat with Shai Barack about how the Android platform team studies performance and understands system health – and what is system health anyway? We talk about measuring performance, deciding trade-offs, and our favorite tools such as Perfetto, Compiler Explorer, and Android Studio’s Memory Profiler.
Chapters:
Intro (00:00)
System health (0:27)
Efforts to make apps more efficient (3:35)
Telemetry data (5:59)
Trade offs between long battery life and good performance (8:21)
Scheduling groups (10:38)
Static drain (13:32)
Collaborating with App developers vs operating system (19:10)
High refresh rates (23:26)
Reach vs engagement (32:02)
What tools does your team use to optimize performance? (34:10)
Godbolt.org (37:09)
Demystifying (39:39)
The best tools are multi-player (43:52)
R8 or R-Not? (45:42)
Optimizing for feature sets (48:05)
Tools, not Rules (50:08)
What are the tools I should be aware of as an app developer looking to upscale performance? (54:36)
Allocation tracker (55:37)
Open source tools (57:08)
Useful resources for devs to understand various tools (59:04)
Final thoughts (1:06:19)
Links:
Link to podcast → https://goo.gle/3ZmnrIO
Compiler Explorer → https://goo.gle/3Zbq6DV
Perfetto → https://goo.gle/3OtD3UK and https://goo.gle/3B3S3p5
Tools, not Rules → https://goo.gle/416CyY7
Catch more Android Developers Backstage → https://goo.gle/adb-podcast
Subscribe to Android Developers → https://goo.gle/AndroidDevs
#Featured #Android #AndroidDevelopersBackstage
