One-Click 2018 Digital Marketing Report Template [Google Data Studio]
Author: Jeff Sauer
Go to Source
 As we enter the new year, I want to ask you a few questions about how your marketing efforts performed over the past 12 months.
Do you know how your content marketing, SEO, and traffic generation efforts performed last year? Did you hit your targets? Did you achieve the year-over-year growth you expected?
I know… I’m coming out guns blazin’ with some big questions. But they are important questions because if you want to see growth in 2019, you need to know what moved the needle in 2018. Was it SEO, social media traffic, new website content, paid ads?

To celebrate the new year, this report template is free through January 31, 2019.
In order to help you answer these questions, I’ve created a one-click year-in-review marketing report template for you! Simply copy the template, connect your Google Analytics and Search Console reports, and voila! You can copy the report template and add it to your Google Data Studio account by clicking the link below.
Use this marketing report to quickly analyze what drove website traffic and conversions in 2018.

In addition to the no-brainer report template download, I’ve also created a video and guide that will walk you through how to create your year-end marketing report within Google Data Studio.
For the rest of this post, I’ll be breaking down the metrics included in the year-in-review marketing report, and I’ll share the results of our marketing efforts for Jeffalytics in 2018.
Year-Over-Year Reports – OMG!
As marketers, it’s a no-brainer to build dashboards to track SEO, website traffic, and conversion results. Usually, we review them on a weekly, monthly, or quarterly basis.
But it’s rare that I see marketers reflecting on an entire year of growth. It’s even more uncommon to see reviews of year-over-year results in a single dashboard.
Maybe that’s because producing a yearly aggregated report is a major pain-in-the-analyst? Or perhaps it’s because we are exhausted from the holiday season?
Whatever the reason, it should be mandatory to reflect on your marketing outcomes over an entire year. And to make doing YOUR yearly review a whole heck of a lot easier, I’m sharing my year-end marketing report and results.
Here are our results in their full glory.

Using this Year-In-Review Data Studio Marketing Report
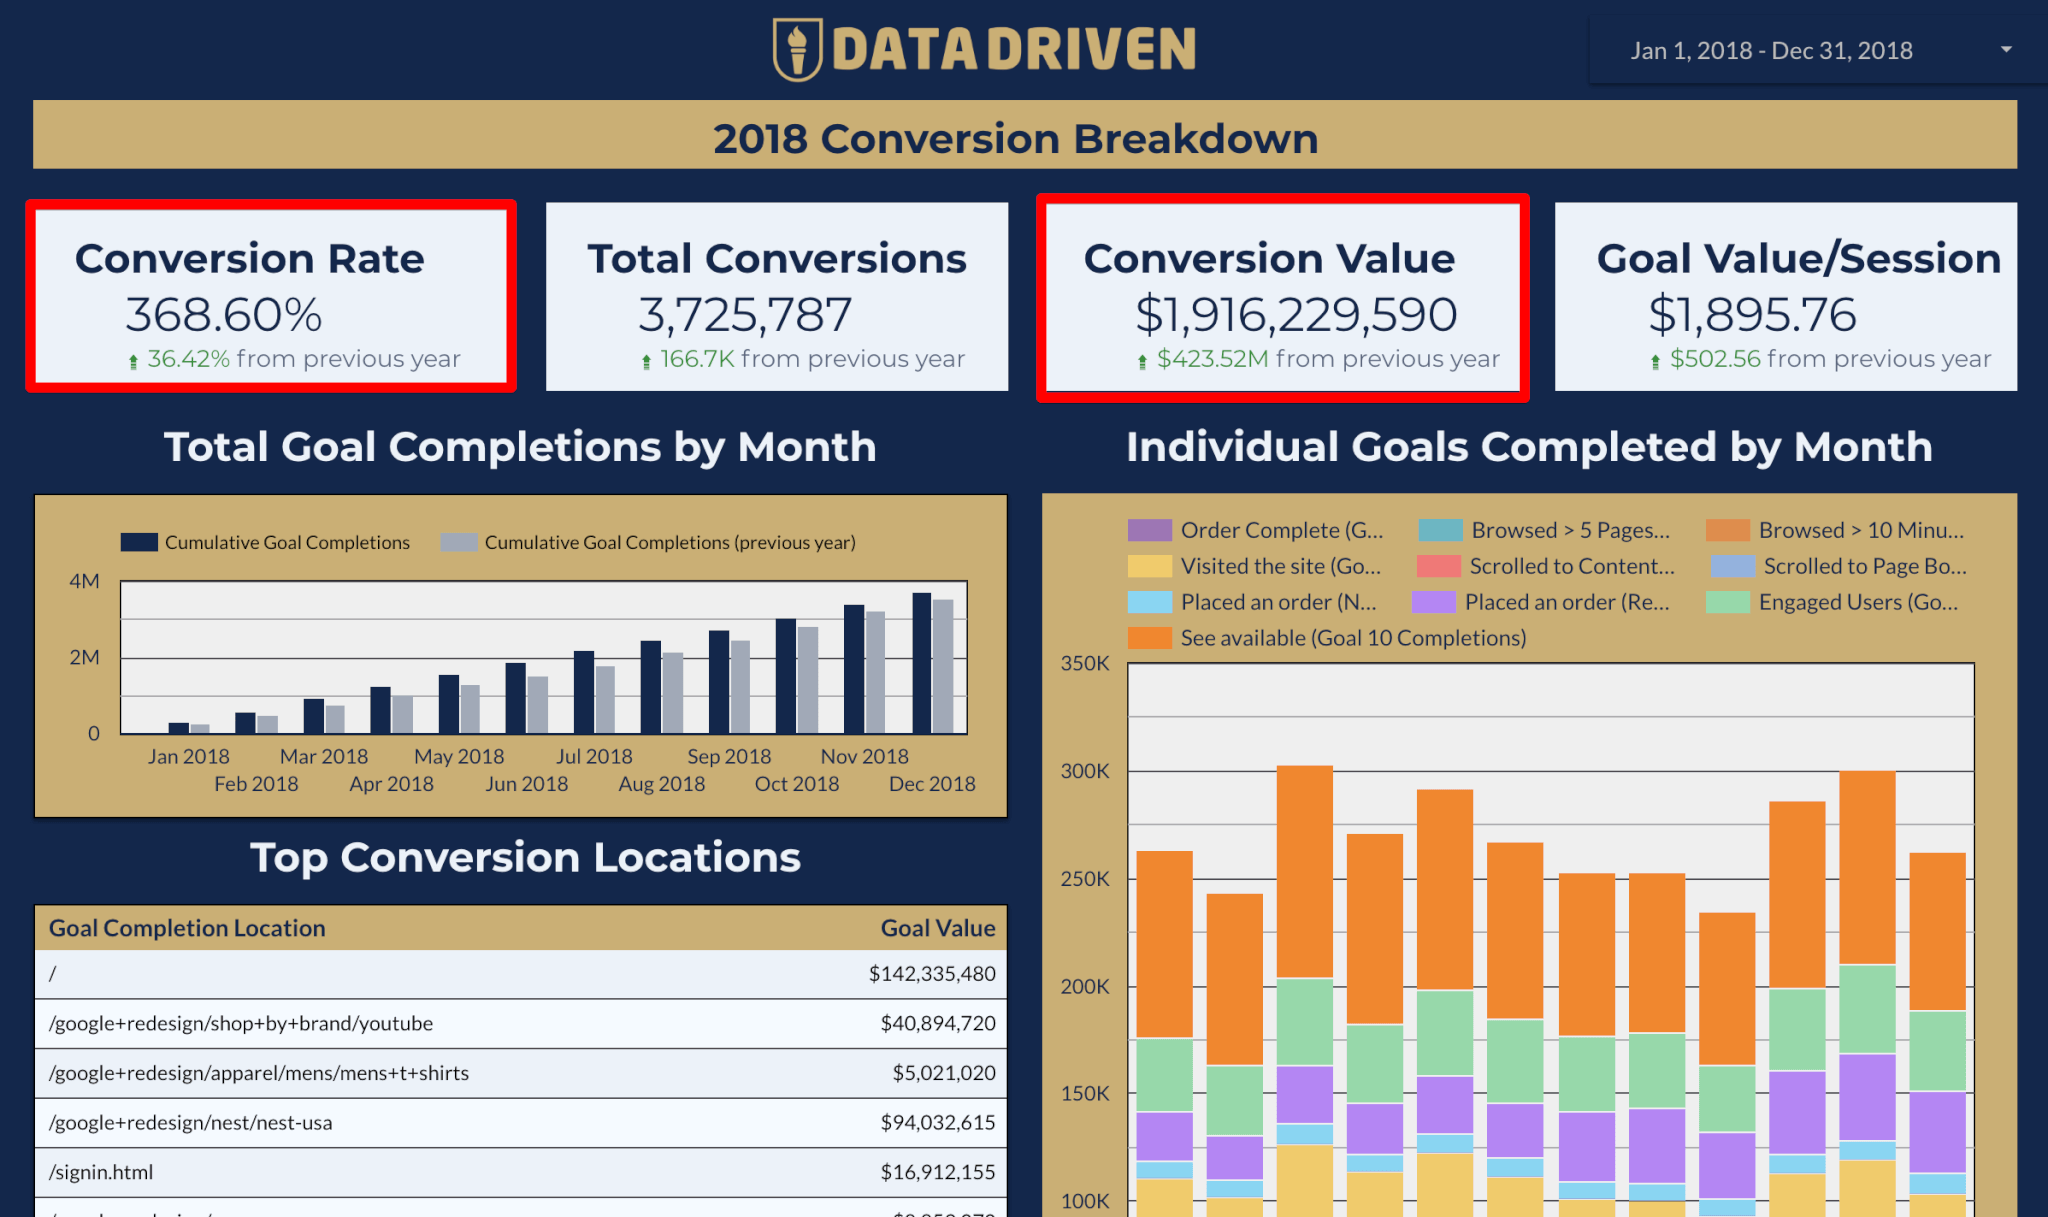
This marketing report template features data from the Google Merchandise Store (GMS). Using the GMS data is a universal way we can all utilize the report template and provides a clean dataset for learning.
However, before you start tinkering with this report, be aware that this data set in not entirely accurate. Based on Google’s sample data, the GMS had 368% conversion rate and sold over a billion dollars worth of merchandise. Those results are literally unbelievable!
What will your data look like in our Year-End Marketing Report?
Assuming you have goals set up Google Analytics when you copy this report to your account and connect it to your data sources, it should reflect your conversion rate and goal values. And no, you shouldn’t have a 368% conversion rate like Google. Or I guess when you own the Internet like Google, you can generate these astronomical conversion rates.
If you do not have goals set up in your Google Analytics account, please take my Analytics Course!!! Inside the course, you’ll learn how to use goals, ASAP. You’ll thank me later.
With all these disclaimers out of the way, I am excited to share what’s in my report with you and share how we achieved our growth objectives at Jeffalytics last year.
Jeffalytics Year-in-Review Google Data Studio Marketing Report
Alright, let’s dissect our year-in-review report using data from jeffalytics.com and see what it can tell us.
The report has four pages.
Website Traffic Dashboard
Page #1 is an overall website traffic dashboard.
Scorecards
The scorecards at the top of page display:
- Total users
- Total Session
- Conversion rate, and
- Total conversions
Below the feature KPI in the scorecard, there is an up or down indicator to shows performance against the previous year.

As you can see, it was a pretty good year at Jeffalytics! My team and I started the year with concentrated effort to drive more traffic to our site through a 90-day challenge, and it paid off.
Our total sessions were up 100% vs. 2017. Our conversion rate was also up 100% (with lots of room for improvement).
Traffic Sources
The session-by-month bar chart in the report shows growth vs. 2017 monthly sessions. And the sessions by channel in the stacked bar chart will reveal the source of your website traffic.

The table below the session by channel chart breaks out traffic sources as well. This table includes goal values by channel, so you can see which traffic sources were the most valuable. Keep in mind the conversion value in this table is goal related, not e-commerce related.

Most popular content
The table in the lower left-hand corner of the traffic dashboard shows you which pages on your site performed the best. It also highlights the page value based on your goals in Google Analytics. Page Value is my favorite content metric inside GA.

Mobile (and Tablet) vs Desktop traffic Dashboard
One of the things I tried to do with page #2 of this report is to show you a clear picture of mobile vs. desktop traffic. This side-by-side view of traffic inside shows you how user devices impact your website’s conversion rate.

As you can see, my mobile traffic to Jeffalytics grew significantly last year. But overall, my website traffic continues to be dominated by desktop users.
Organic Traffic Dashboard
Page #3 of the report uses both Google Analytics and Google Search console data. It’s a hybrid report from both sources.
Adding Google Search console data to this report allows you to review the search queries that sent users to your site. It also provides insight into how many clicks Google search drove to your website.

Conversions Dashboard
The last page of our year-end marketing report, page #4, is dedicated to conversions.
This area of the report shows goal completions by month and goal URL. And the bar chart breaks out each goal you’ve set in Google Analytics so that you can see which offer on your website drove the most conversions.

What do your results tell you?
I tried to make this dashboard as universal as possible so that you can plug it into your data sources and see your results right away.
If you’re interested in getting access to more done-for-you marketing reports, and learning how to use Google Data Studio like a pro, check out Data Studio Mastery. In this training program, I show you step-by-step how to hook up your data sources and how to add your specific KPIs to your reports.
No matter your website marketing activities for 2018, this report should highlight your results (as long as driving traffic to your website was an objective).
If you’re excited about what you see when you plug your data into this report, please share your outcomes in the comments below.
A concentrated effort (and hard work) will pay-off in the long run
For those of you that follow Jeffalytics, you may remember I started last year with some pretty ambitious goals. I was so dedicated to growing traffic to my site, that my team and I spent 90 straight days producing both written and video content.
When we looked at our results month-by-month or quarter-over-quarter, we started to see some growth in the second half of the year. But looking at our growth year-over-year put our progress in perspective.
In early 2018, I wrote a blog post with my 2018 website goals.
We set a target of 100% increase in website traffic – we achieved that goal. We also increased website conversions by 100%!
Next year’s objectives
As we turn the page on the new year, it’s time to start working towards new goals. When you review your progress in this report, what story do you want it to tell about 2019?
At Jeffalytics, we want to take things to the next level. I’ve set growth targets of a 100,000 website sessions a month and 30,000 conversions (a 300% increase).
Last year my team and I dedicated the first 4-months of the year to content production. This year is all about improving SEO results and maximizing the value we provide through content. To achieve these goals, we need to get to work consolidating and updating/optimizing existing content, as well as creating new assets.
We also look forward to providing as much value as we can to our analytics, PPC, and digital marketing communities through our new Data Driven platform.
Want more data about Jeffalytics? Check out my way-too-early 90-day challenge results.
This year we have multiple automated Google Data Studio reports for staying current with our progress. Just like every year, I promise to continue sharing what works, what doesn’t work, and what we learned.
You can follow along with my progress on this blog as well as on our Twitter, Facebook, and Tinder feeds (OK – not Tinder, just wanted to make sure you were paying attention).
What are your 2019 marketing objectives?
If you have your objectives set for 2019, make yourself publicly accountable by sharing them in the comments below. In addition to trying to bring value and knowledge to our community, one of the other reasons I share my goals is to hold myself accountable.
So let’s work together. Share your objectives in the comments below, and we’ll hold each other accountable.
Don’t have your objectives set for this year yet? Stay tuned! In the coming weeks, I’ll be sharing a new guide about how to set data-driven marketing objectives.
The post One-Click 2018 Digital Marketing Report Template [Google Data Studio] appeared first on Jeffalytics.