Using Graphics To Improve Learning
Source http://theelearningcoach.com/elearning_design/using-graphics-to-improve-learning/
Source
 Although no one can say that visuals are always superior to words, the principle known as the picture superiority effect should convince you that using effective visuals will improve learning. The principle states that people generally have a better memory for pictures than for corresponding words.
Research in many areas of learning, such as recognition, recall, comprehension and problem-solving point to the fact that visuals enhance learning in many situations. Considering how pictures are widely used in advertising and marketing communications, this shouldn’t be shocking news. As designers and developers, we need to focus more on the superiority of visuals and use them strategically. Here are some ways you can use pictures to facilitate learning.
 Narratives-Scenarios-Stories
When you’re using a storyline to relate a scenario, use still photos to add emotional depth and to ensure the audience gets the message. Surprisingly, a voice over can work well with still photos if you don’t have the budget for video. Ideally, you can pan the photo (move horizontally across it) or zoom in or out of the photo to add a sense of action.
 Abstract Concepts
Diagrams and graphs can help learners comprehend abstract concepts using visual language to depict meaning. For example, in diagrams the connecting lines between elements help learners understand relationships. Bar graphs make it easy to compare data; line graphs help learners understand trends. So, concretize abstract information with a corresponding visual when possible.
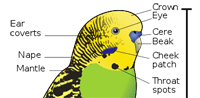 Parts and Components
Use labeled illustrations when learners need to understand specific parts of something. This is particularly useful when there are many components or when the parts are microscopic, hidden or invisible.
 Motion and Paths
Visuals are a potent way to show the movement of one or more entities. You can depict motion along a line, as in this graphic that shows the path of Hurricane Katrina. You can also depict motion with arrows, such as showing the moving parts of a machine.
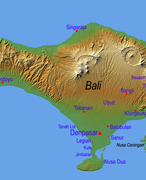 Geography and Statistical Data
Maps are ideal for helping learners understand location and geography, but they can be used for more than these purposes. Statistical maps represent variations in quantity of a particular factor, such as population, crime rates, cell phone use or political affiliations. Learners quickly perceive and understand map information because it is a commonly used visual format.

Concrete Ideas
Perhaps the most obvious use of visuals is to show a concrete and familiar object. When learners are familiar with the items in a photograph or illustration, it may not facilitate learning, but pictures provide an aesthetic appeal that can serve to motivate them. Be cognizant of the fact that if “eye candy” is extravagant, it could detract from the learning event.
 Metaphors
Instructional designers like to use metaphors to explain something unfamiliar by comparing it with a familiar object or idea. Metaphors offer an excellent opportunity for using visuals, because they work well as mnemonic devices—helping learners to remember new information.
If you’re interested in visual design for eLearning, see my book Visual Design Solutions.